Indicator upgrade
Consider as an example that the UN releases a new dataset on their Population estimates. In our catalog, we have an old version of it, and rely on its indicators for various charts on our site. As a consequence of UN's new release, we now need to update our catalog with the new version, and, because of that, we also need to update all the charts that rely on the old indicators.
This process is very common in our workflow, and we have tools to help us with it. This guide will walk you through these.
Create the new steps
In the etl repository, create a new branch for your work.
git checkout -b data/new-dataset
Create all the new steps required to import the new dataset. Note that this guide only applies to those datasets that make it to the database (e.g. have Grapher steps). Other datasets are not relevant, since they are not used by any charts.
You can create these steps manually, by duplicating the steps from older versions of the dataset and updating them accordingly. Alternatively, you can use the Wizard.
Add the new dataset to grapher
Once you have implemented all the steps, test if the dataset can successfully be added to the Grapher:
etl run <short_name> --grapher
Choose the database
We recommend using the environment variable STAGING to select which staging server to upload the new dataset to. Here, you can use your personal staging server.
STAGING=yourname etl run <short_name> --grapher
Learn more about setting up your personal staging server
If that works, push all your changes to the remote branch data/new-dataset and create a draft Pull request (PR). This will trigger several things:
- A dedicated staging server will be created for your PR, in which the OWID admin site and databe will be running (you need tailscale to access this server).
- An etl build will be executed in this new server, with the new steps you created.
Consequently, your dataset and all its indicators will be available from the admin page of the PR staging server.
Match old indicators to new ones
Chart revision
Charts at Our World in Data are based on a config file, which contains several configuration parameters (variable IDs in use, title, subtitle, etc.).
etlwiz assists you with the creation and update of these configuration files.
Once a dataset is available on the Grapher database from your PR staging server, you can create charts from its indicators. You need to update all the charts that rely on the old indicators to use the new ones. This is done with the Chart Upgrader app in Wizard, which is accessible in the admin site of your PR staging server (at https://staging-site-name/admin/etl/wizard/).
Alternative
You can also use etlwiz locally, and use the environment variable STAGING to select which staging server to submit the revisions to.
STAGING=yourname etlwiz charts
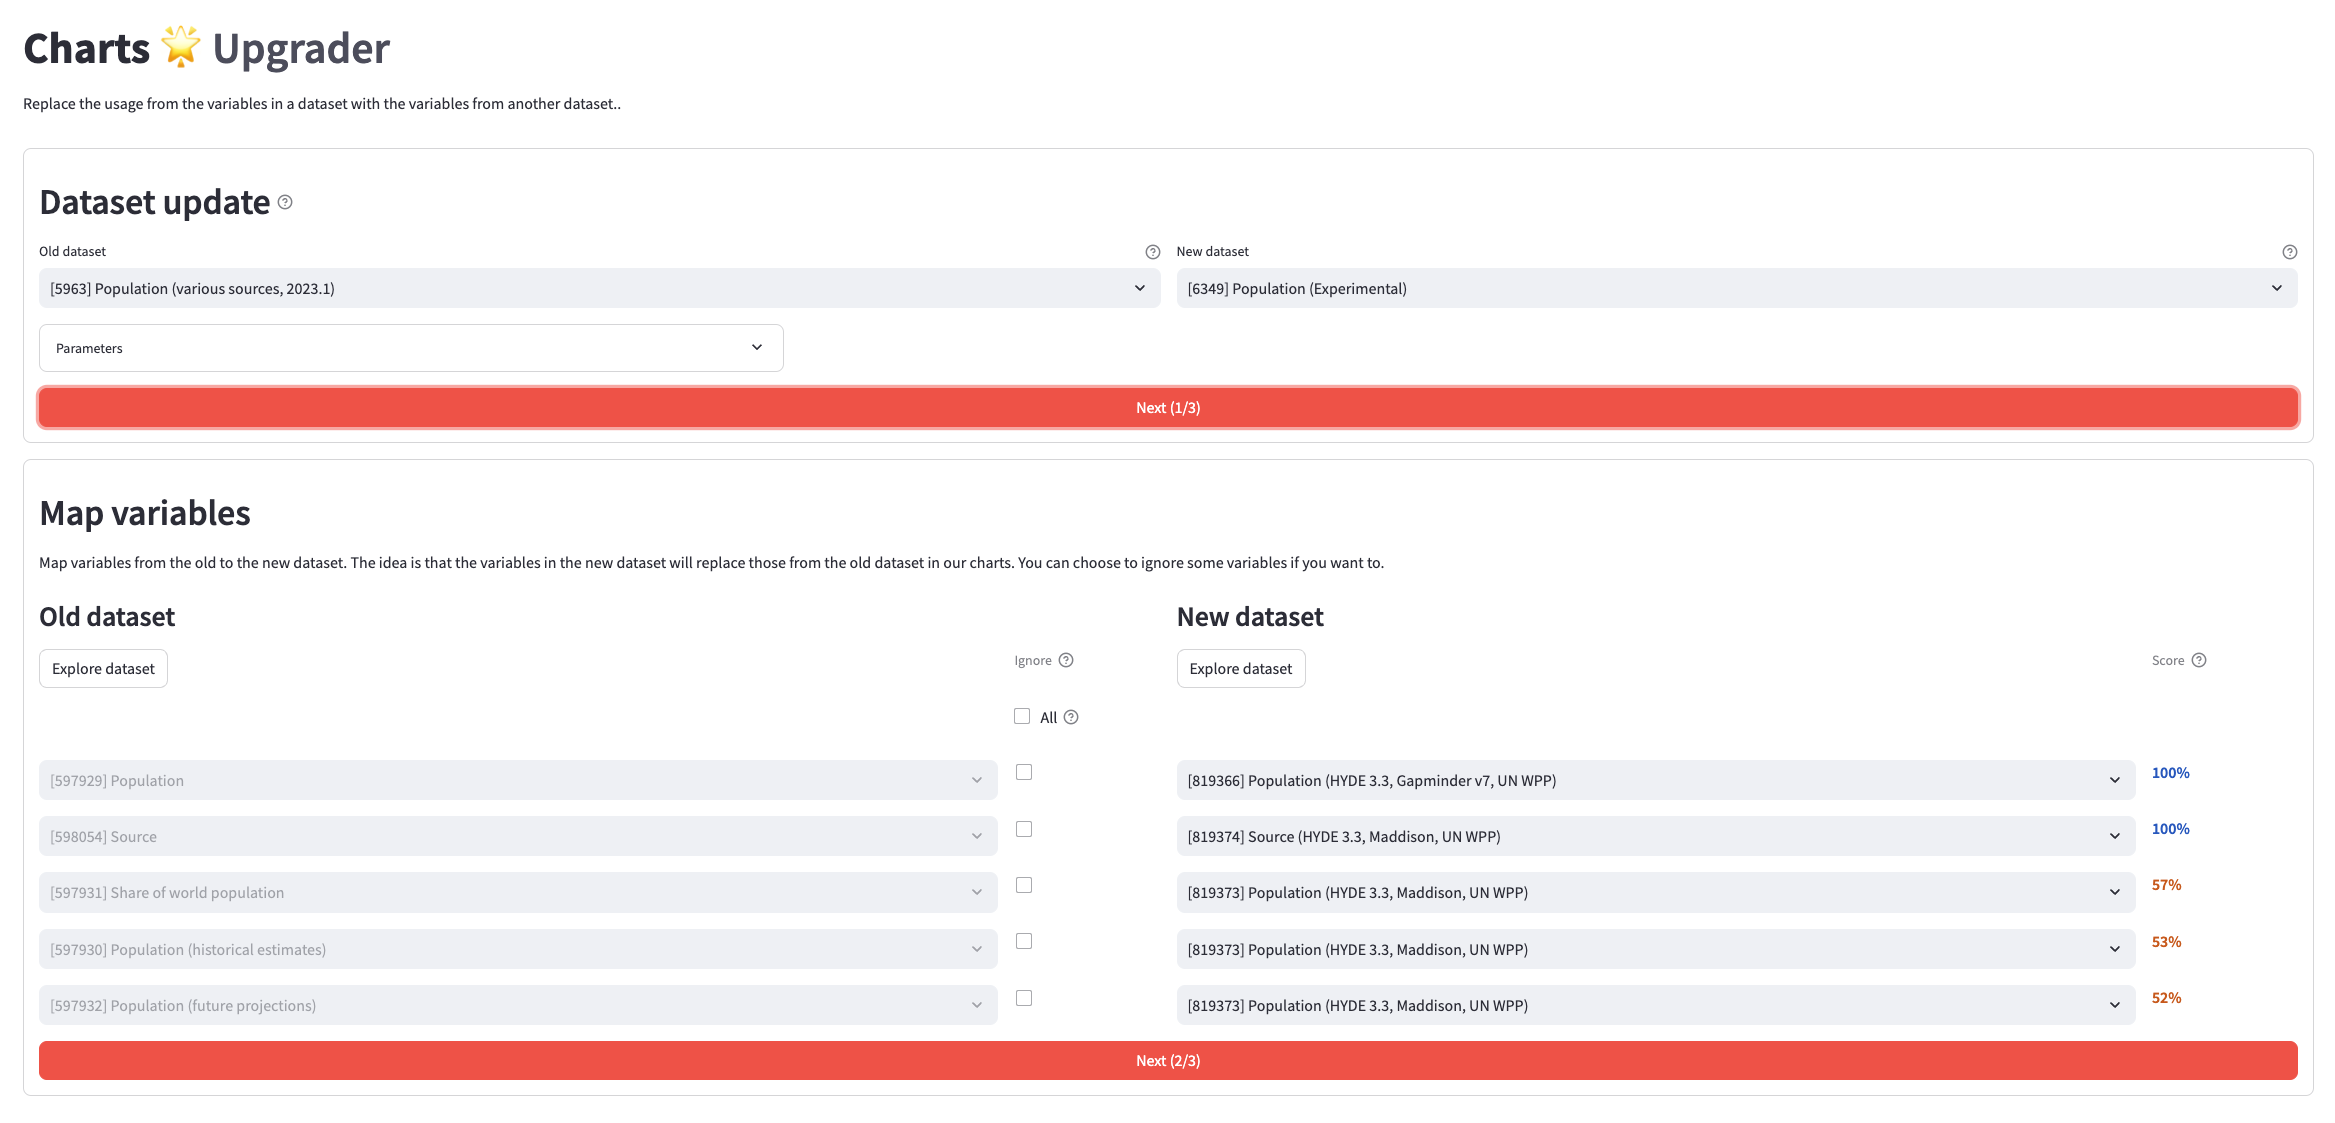
This tool will help you match indicators from the old dataset to indicators from the new one by asking which dataset is being updated (old and new one) and how each indicator is mapped to a new one. The tool will guide you through the whole process of creating chart revisions.
Tips
- Under the expandable window "Parameters", check the "Explore indicator mappings" option to display indicator comparisons on the fly.
Once you have finished, your chart revisions are submitted to the Grapher database of the PR staging server, and are ready to be reviewed from there.
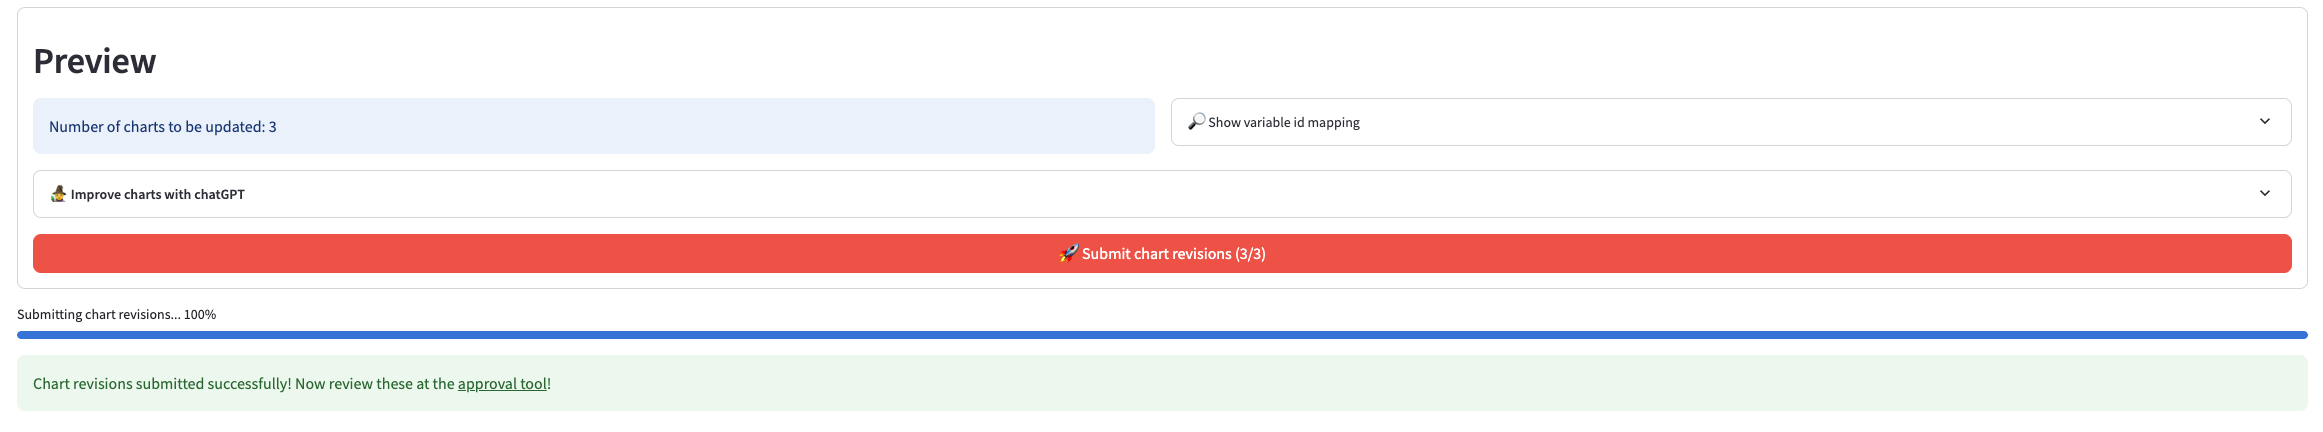
Notes
- All chart suggestions are stored in the grapher database table
suggested_chart_revisions.
Approving new charts
Once you have successfully created and submitted your chart revisions, go to the admin tool "Suggested chart revisions" (in the environment determined by STAGING). You can find it in the admin panel, on the right menu bar under "DATA".
In there, you will be presented with all the chart revisions, which you can approve or reject. Approving a chart revision means that the chart will be updated with the new configuration. You can read further under the "Instructions" tab. Note that you can filter these by the user that created them.
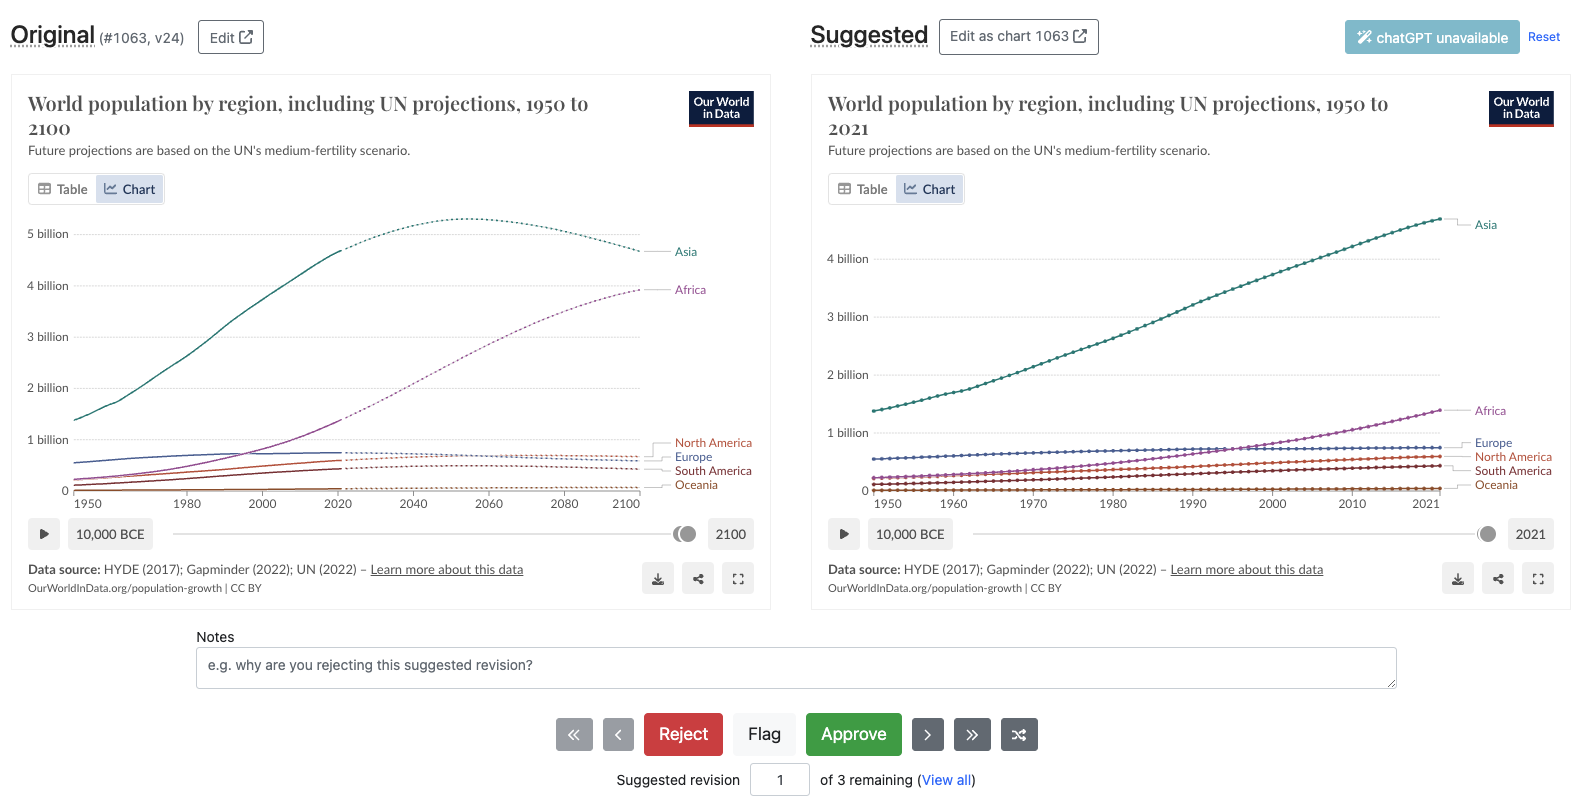
For the chart approval process, feel free to involve other stakeholders (data managers, researchers, etc.) to ensure that the revision is done correctly.
Optionally, once the charts are approved, you can further fine-tune them in their respective edit pages.
Adding tags to existing charts
There is a technical limitation related to chart tags: If you create a new chart and add tags to it, the Chart Sync tool (see below) will be able to transfer those tags from your current environment to production. However, if you edit the tags of an existing chart, those changes will not be synced.
Merge your changes
After approving all the new charts in your PR staging, and your PR code has been approved, you can merge your changes to the master branch.
Once your branch is merged, the ETL will run again, and the new dataset will be available in the live site (this might take some time).
Sync the changes to live
Once the new dataset is available in the live site, you should sync all the approved charts from the PR staging server to the live site. This can be done with the Chart Sync app in Wizard (or etl chart-sync command).
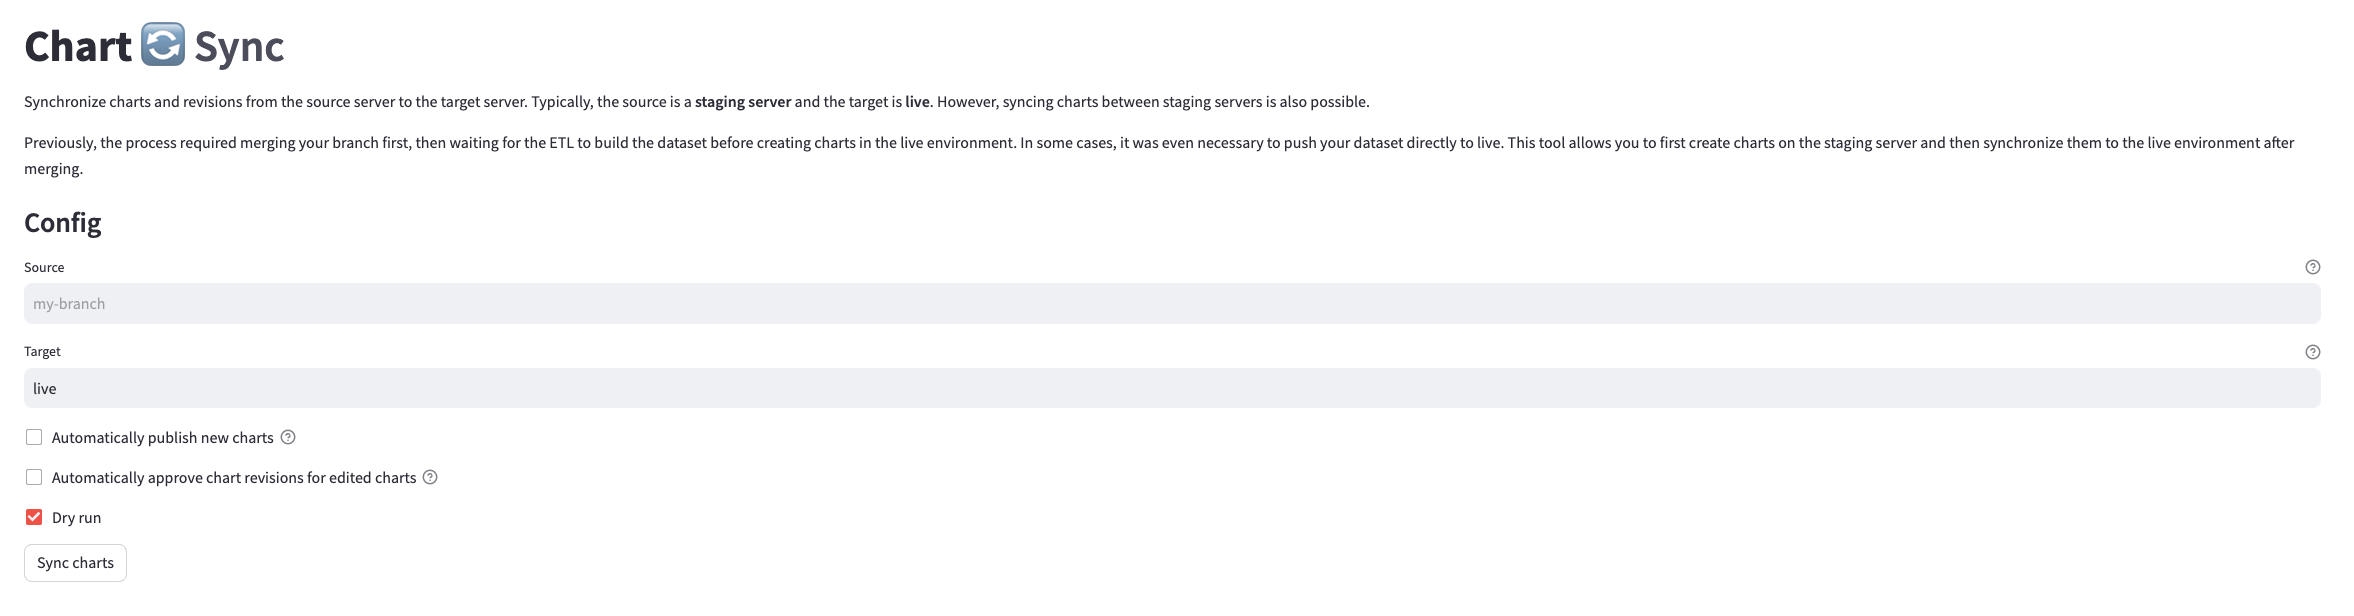
In there, you need to specify the source and target servers, which typically are the PR staging server and the live site, respectively.
Final chart approval in live
Once your charts are synced with live, these will be avaialble as suggested revisions, under the "Chart Approval" tool.
This means that you will need to approve the charts once again. This serves as a double-check to ensure that the charts are correctly updated in the live site.